
Introduction. In the last post how to complete a repeat desaturation protocol was discussed. This protocol is especially useful for multimodal and team sport athletes. Briefly, using a sport specific exercise modality, have an athlete complete repeated sprint intervals (~20s) until they can no longer desaturate or recover SmO2 to the same extent as the start of the workout. Using this data, coaches and athletes can get an idea of sprint endurance capacity which will inform substitution patterns in team sports activities and pacing strategies for other sports. In this blog post I want to walk through an example of a repeated desaturation protocol completed by a cyclist to get an idea of his capacity for accelerations/attacks during a race.
Protocol. This assessment was completed on a stationary bike. The cyclist was instructed to go hard (>500 w) for 20s, followed by a 1 minute spin rest. The athlete completed 9 reps of 20s hard 1 minute rest. For the first three reps the athlete maintained intensities above 500w, for the next three they maintained >550w, and for the final three they maintained >600w. The test was stopped after the 9th rep because SmO2 was not able to be depressed to the same level as previously seen, shown in figure 1. Furthermore, the athlete was getting extremely tired, while this was not shown by the SmO2 response, it is still important to keep in mind an athletes perceived exertion. Finally, to test if the athlete could still fully desaturate after multiple hard efforts the test finished with 15s all out. This was to get an idea of how close to max the athlete was operating during their sets. Indeed, the athlete was able to desaturate to 15% which is lower than the 20-25% seen during the intervals.
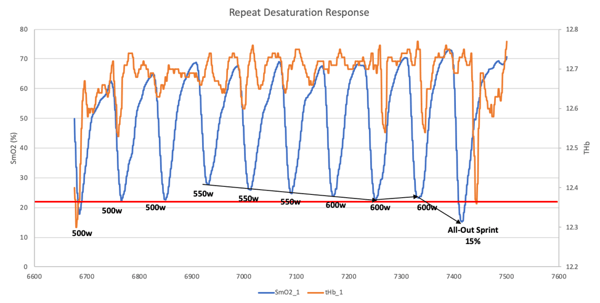
SmO2 Response Analysis. From figure 1, we can get an idea that the athlete was probably not fully warmed up, as the first few intervals resulted in recovery SmO2 values that were significantly higher than the first. After the third interval the recovery SmO2 seemed to reach the same level (~70%) over the 1 minute rest. From the blue line representing SmO2 its evident that SmO2 values consistently drop from the fourth to the ninth interval. With the ninth interval resulting in an SmO2 around 22%. This value, plus or minus 5-10% is important. When monitoring an athletes SmO2 during a workout or game, if an athlete approaches or goes under this level of desaturation repeatedly, we could predict that they might be accumulating fatigue, which might benefit from substitution, a longer rest, or decreased power output. In the example of the cyclist, if they saw that going up a hill, they dipped below this SmO2, at the top of the hill it would be beneficial for them to back off on power output until SmO2 recovered back to 20-30%.
THb Response Analysis. Total hemoglobin/myoglobin volume underneath the sensors is displayed as THb (orange line) in the figure above, this value acts as a surrogate for blood flow underneath the sensor. Evidence that the athlete may not have been completely warmed up is further shown by the increasing THb values during the first two intervals. THb is increasing due to increasing heart rates and potential vasodilation of the vessels supplying blood to the muscle. Furthermore, by increasing the athletes power output slightly throughout the repeated sprints we can get an idea of the athlete blood vessel response and where it goes from a compression, or venous response to an arterial occlusion. From the THb response line the transition from venous occlusion to arterial occlusion is illustrated by the flat line in THb seen during the first 600w interval. When an arterial occlusion happens blood volume does not change because it cannot be delivered or removed from the site being monitored. This means that more oxygen needs to be extracted from the blood in the muscle, and more metabolites build up. When an arterial occlusion occurs, the onset of fatigue is accelerated. The speed/power where arterial occlusion occurs is important to note and should be ‘saved’ for final sprints across the finish line, or for the very end of games.
Conclusion. The SmO2 and THb response of an athlete to repeated sprint desaturation protocol can glean some very important information that coaches and athletes can use to make more informed decisions about racing, games, or practice. SmO2 values, when monitored in real-time can give a coach or athlete an idea about threshold/target values that the athlete should remain above. THb response gives coaches and athletes an idea of where arterial occlusion occurs, or when it is occurring (a flat THb curve), so the athlete or coach can instruct the athlete to back off or if it’s towards the end of a workout, game, or race, they can complete a final sprint to the finish.