
 In this post, I want to go beyond simply determining training intensity zones to determining what factor is limiting the performance intensity of the athlete.
All of the systems that have been discussed so far in this 8-part blog series are primarily concerned with determining training intensity zones, but none of them shed any light on why those zones are what they are. This leaves some open questions like:
-
Why does one athlete have an FTP of 230 watts and another athlete have an FTP of 275 watts?
-
What changes when my performance intensity increases due to training?
-
What’s different at intensities below my sustainable pace versus above my sustainable pace?
-
What types of training and what training mix will help me improve fastest?
Muscle Oxygen monitoring has 3 unique attributes that help provide answers to these questions:
1. Muscle Oxygen Monitoring measures two independent parameters, SmO2 and THb, simultaneously. Doing so provides information on how oxygen is being delivered and how it is being utilized.
2. Muscle Oxygen parameters have a response time of 5 seconds or less, so the effects from changes in load can be observed in real time.
3. Muscle Oxygen parameters can be measured on working and non-working muscles at the same time, which provides information about both the local and the systemic response to load.
Background Physiology
To understand how Muscle Oxygen monitoring can help provide answers to these more complex questions, we first need to review some physiology. The table below lists some of the more important factors that contribute to the muscle oxygen readings of SmO2 and THb.
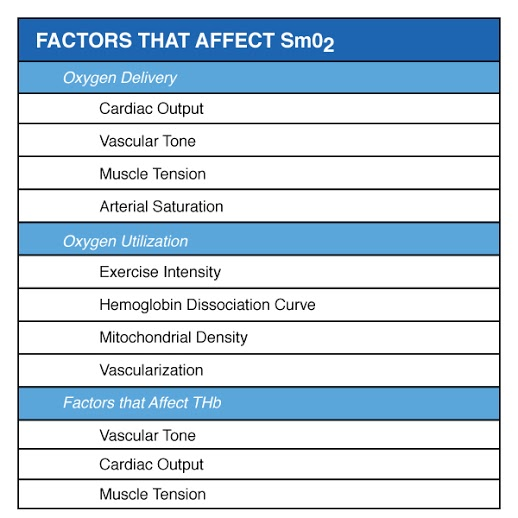
I won’t go into detail on each of these factors here. What’s important to note is that there are many factors at work. This is why taking an isolated snapshot of muscle oxygen information isn’t very useful. For example, SmO2 values at rest can range from 40% to 80%. Any number of a combination of factors could be causing the reading.
However, human physiology has several attributes that help us sort out what is going on. Three in particular are especially relevant to muscle oxygen monitoring:
1. Different response times of the Delivery and Utilization systems at the onset and end of loads.
2. Related, but different responses in working and non-working muscles
3. Different responses at different loads.
Response Times
At the onset of a load or at the end of a load, the oxygen consumption in the muscle starts or stops almost immediately, while the oxygen supply systems take tens of seconds or minutes to respond to a change in load.
Muscle oxygen monitoring is measuring in real time in the muscle, right where the oxygen consumption is taking place. By having the athlete alternate between a loaded and unloaded state, we can watch how the SmO2 and THb respond and infer which system is limiting performance.
The following table contains the same list of factors as above, but relative response times have been added.
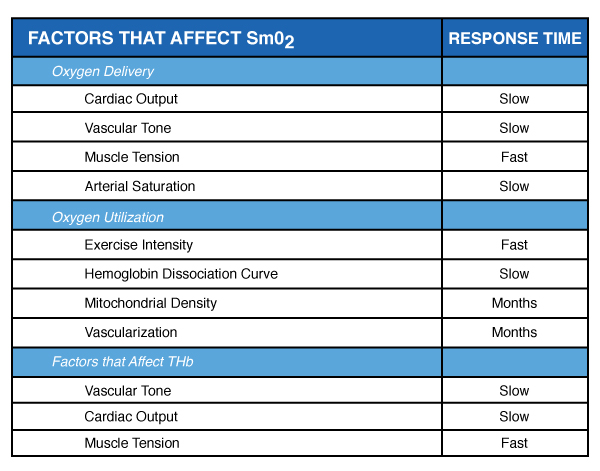
The differences in relative response times are the reason why the 5/1/5 test (Training Intensity Profile or TIP) is designed with one-minute rest periods in between load steps.
By observing the muscle oxygen response when the load is quickly started or quickly removed, we can obtain evidence about how the various physiologic systems are reacting.
For example, a sudden decrease in THb at the end of a load might suggest that muscle tension during the load is creating a venous occlusion which is restricting return blood flow. Or, if the SmO2 drops very little or not at all at the onset of a very intense load, that could suggest that the hemoglobin dissociation curve has shifted to the left and respiration might be a problem.
The following graph shows an example of rapid and slow changes in THb. This data is from a 5/1/5 test, which is comprised 5 minutes of load followed by 1 minute of rest between each load. You can see that the THb responds with a very rapid increase when each load is stopped. You can also see the THb increasing slowly during each load.
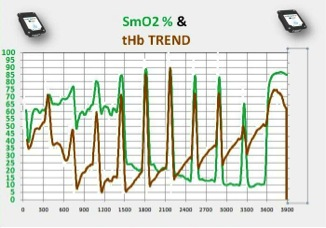
Figure 1 – THb increasing rapidly at end of load and increasing slowly during load
Working vs Non-Working Muscle
Another opportunity to further discern the muscle oxygen data is to measure on working and non-working muscles at the same time.
For a runner or a cyclist, you might measure on a vastus lateralis and a biceps. Some of the factors on the list only apply to working muscles like Muscle Tension. Other factors, like vasoconstriction due to the respiratory metaboreflex, apply to both working and non-working muscles.
As an example, you may see an increase in non-working muscle THb at the onset of exercise, and then see a reduction in non-working muscle THb when the respiratory metaboreflex kicks in.
The respiratory metaboreflex occurs when the body restricts blood flow to the extremities to preserve flow for the respiratory muscles. This is a sensible survival response if the respiratory muscles PO2 gets too low. The response can be identified as something different than a muscle tension response by measuring on non-working muscle.
The following example shows the SmO2 trend on a hockey player. The red SmO2 trace is from the biceps, while the green SmO2 trace is from the vastus lateralis.

Different Responses at Different Loads
This example brings us back to training intensity zones again. The body responds to low intensity loads differently than it responds to high intensity loads, so a certain response at low intensity might be interpreted differently at high intensity.
For example, it’s normal to see SmO2 increase with increasing load at low intensity. This suggests an increase in cardiac output and vasodilation in response to the load. At higher intensity levels, the SmO2 typically drops with increasing load.
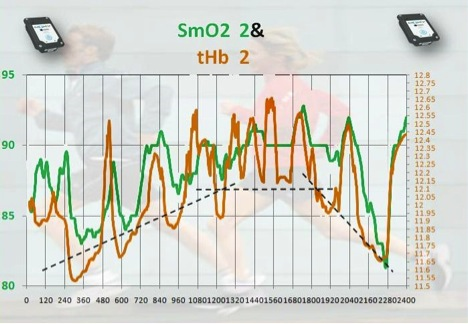
The following chart shows the SmO2 and THb response during a step test. Both SmO2 and THb increase with increasing load at the beginning and decrease with increasing load at the end.
Complexity
I sometimes get feedback saying this is all too complex to understand. Many people have suggested to me that we need to simplify muscle oxygen monitoring down to a red-yellow-green system to tell the athlete when to slow down and when to speed up.
I think that is missing the point of using muscle oxygen monitoring for training.
I have to agree that using muscle oxygen for training isn’t as simple as a red-yellow-green type of system. However, here’s the unavoidable reality: human bodies aren’t simple.
Imagine 4 marathoners who are all capable of running 7-minute miles and have similar lactate thresholds. All 4 have a goal to get to 6:45 miles. One of them has a core muscle strength issue that limits the ability to expel CO2.
The second has a mitochondrial density issue that limits oxygen consumption. The third has a stroke volume issue that causes the respiratory metaboreflex to kick in. The fourth is very fit, but is limited by the extent of his or her running efficiency.
A training plan based on a simple system like Lactate Threshold would give all 4 marathoners the same training plan. A red-yellow-green system would tell them all to slow down if they were above the Lactate Threshold or tell them all to speed up if they were below it. It wouldn’t indicate which athlete needed strength training or which one needed to do long-slow distance.
While all four runners might improve and eventually reach their goal, they could improve much faster if each of them had a training plan which targeted their specific limitation.
Consider an athlete who has a respiratory limitation. The body might compensate by adapting the cardiac system to produce a higher stroke volume. It doesn’t make sense to prescribe a lot of interval training for this athlete – he or she is already stressing the cardiac system with every run. Some core strength exercises that improve the respiratory muscle efficiency could be much more beneficial and wouldn’t tax the rest of the body needlessly. By identifying and targeting the limiting system, the athlete can increase performance faster.
Summary
This series of 8 blog posts has looked at several methods for determining training intensity zones and ultimately compared them to Muscle Oxygen Monitoring. Muscle Oxygen Monitoring overcomes two fundamental limitations of the other methods:
- Muscle Oxygen Monitoring uses physiologic data to determine all training intensity zone transitions, where the other systems typically find 1 transition point and calculate the other intensity zones based on a percentage of that point.
- Muscle Oxygen Monitoring can be used to identify what is limiting the performance of the athlete. None of the other systems provides any useful information in this regard. This allows the trainer to go way beyond determining intensities to designing an entire training program based on the needs of each athlete.
Muscle Oxygen Monitoring is a powerful new tool that athletes and trainers can use to understand the physiologic limitations of their performance and to guide training to overcome those limitations.