In the last blog post I discussed the use of a 3 minute critical power test to monitor, and dictate racing and training for cyclists. Just to recap, after warming up, begin the 3-minute all out test by shifting to a gear that will allow you to get the highest power output, ride as long and as hard as possible, shifting gears so that by the end of the three minutes you’re pedaling at your preferred cadence. Typically between 80-100rpm. Average the power output for the last 30s of the 3 minute test and use that as critical power, it’s as simple as that. In this blog post I want to detail the results of three 3 minute critical power tests that I did while wearing a Moxy monitor on my right VL. These tests were done to try to identify if there is a critical SmO2 as measured by Moxy and differentiate between HR and SmO2 signal.
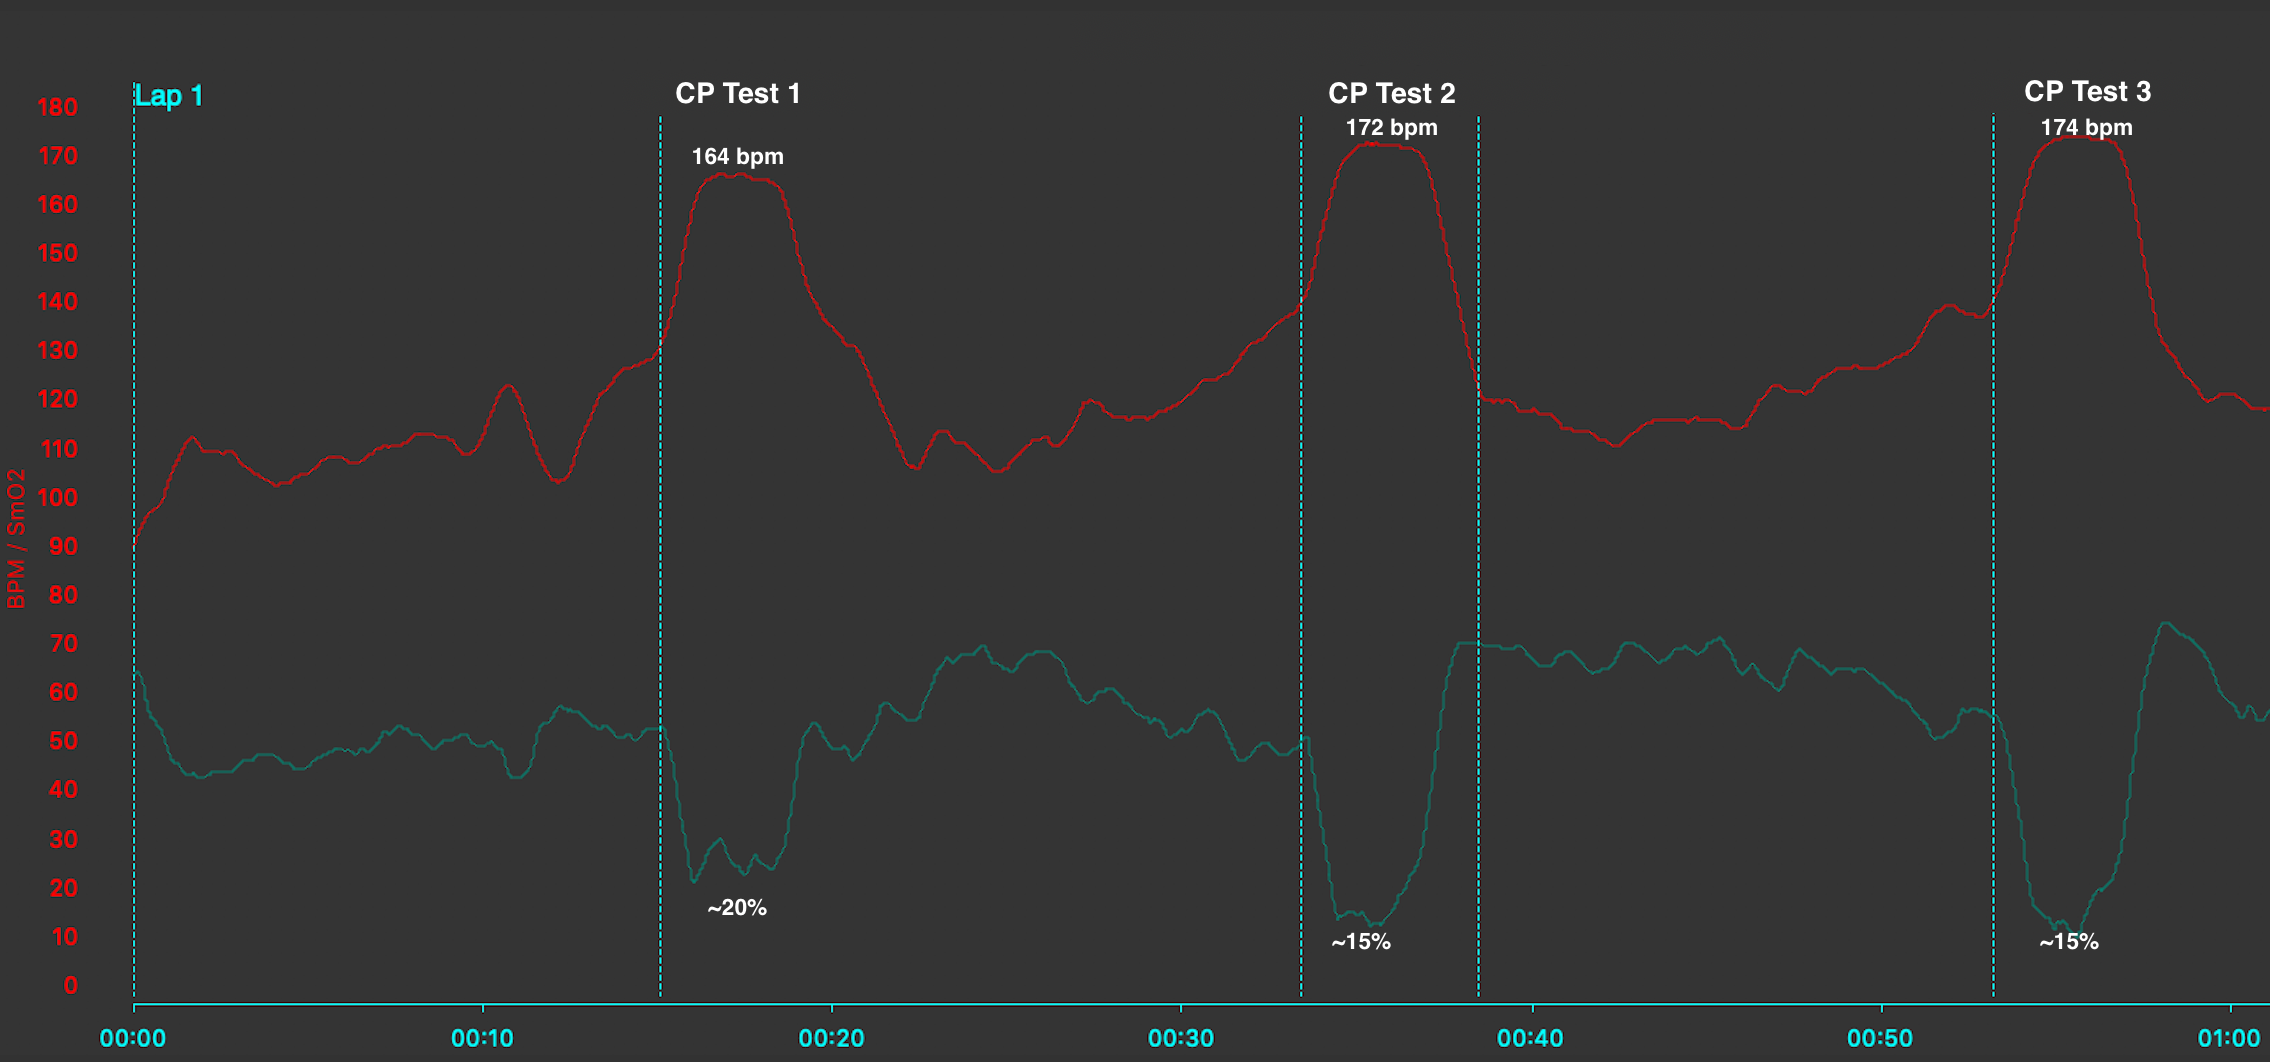
The overall workout is displayed in figure 1 with the red line representing heart rate, and the blue line representing SmO2. Overall, you can see that the first 3min CP was a little too easy because it only elicited a heart rate of 164 and minimum SmO2 of ~20%. CP test 2 and 3 were more closely related, eliciting a max heart rate of 172 and 174, and minimum SmO2 of ~15%, respectively. This indicates that the 2nd and 3rd CP tests were closer to maximal and more representative of my maximal work capacity. From an overall workout perspective it appears that both heart rate and SmO2 seem to track well and respond to a maximal all-out effort in a similar fashion.

In order to depict the differences between SmO2 and HR response, figures 2-4 were created and represent a closer view of both heart rate and SmO2, in all of these figures HR is represented again by a red line, and SmO2 is represented by the blue line. Figure 2 shows the SmO2 and HR response of CP Test 1. From this figure you can see that again during the first CP test heart rate increase to 165 bpm. SmO2 is a bit different, first it drops to 17% then slowly rises until it stays steady at 23%.
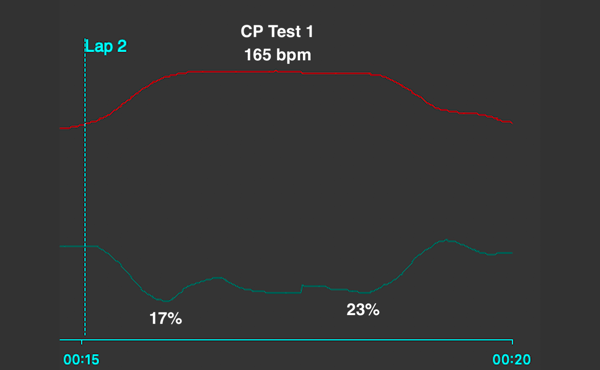
Figure 3 shows the SmO2 and HR response of CP Test 2. From this figure you can see that again during the first CP test heart rate increase to 172 bpm. SmO2 is a bit different, first it drops to 12% then slowly rises until it stays steady at 23%.
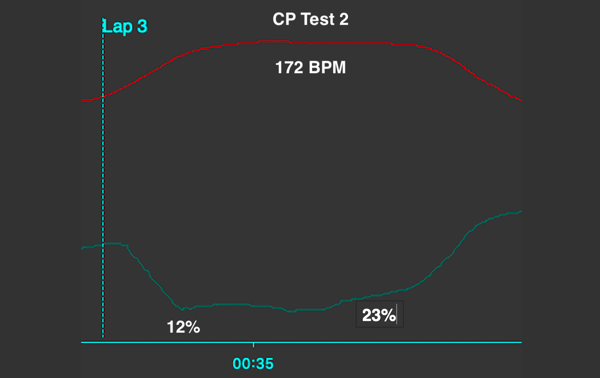
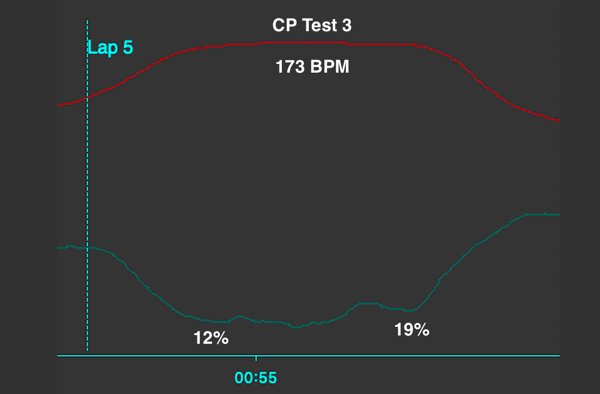
Figure 4 shows the SmO2 and HR response of CP Test 3. From this figure you can see that again during the first CP test heart rate increase to 173 bpm. SmO2 is a bit different, first it drops to 12% then slowly rises until it stays steady at 19%.
Overall trends. Figures 2-4 display a rapid increase in SmO2 after the cessation of the interval. This increase and subsequent recovery back to baseline is often, if not always, faster than heart rates recovery response, which indicates that the muscle is more quickly recovered and could indicate that the athlete is ready for their next interval faster than heart rate would indicate. This granularity in recovery of oxygen kinetics at the level of the muscle allows for well-tailored, individualized rest intervals for an athlete, allowing for higher customization of training protocols.
Furthermore, all three all out tests show an increase in heart rate that stays very high for the entirety of the interval, whereas SmO2 depresses to very low levels before slowly creeping up to a maintainable SmO2 for the remainder of the interval. The second value indicates the steady state level to which oxygen saturation can be decreased and maintained through oxidative phosphorylation capacity of the mitochondria.
Overall, seeing the physiological response to a 3min critical power test can lend big insights into the fitness level of an athlete, and to end I want to summarize three key takeaways from these tests.
Key Takeaways:
- My maximum desaturation capability is around 10%, meaning that during very hard intervals depressing SmO2 to ~10% should mean maximal effort.
- Based on all three CP tests I should be able to maintain an SmO2 of > 20% during a long cycling race as long as nutrition stays consistent.
- SmO2 responds more readily to maximal effort critical power tests than heart rate does.