The last blog post discussed how to complete a 5-1-5 Assessment to evaluate which system: cardiac, pulmonary, or muscle oxidative capacity was most limiting to an athlete’s performance. In this post I will detail how to interpret the data to determine which system is most limiting. Upon completion of a 5-1-5 assessment, 2-3 graphs will need to be analyzed. 1) A total hemoglobin (THb) response graph which indicates how much blood is present underneath the sensor and 2) A muscle oxygen saturation (SmO2) response graph which indicates how much hemoglobin is oxygenated in the capillaries under the sensor. Optional: a third graph with heart rate response. Its typically more helpful to have the power/speed step graph overlaid with each graph to know when the power/speed is changing. Limitations are typically identified by trends in the THb and SmO2 response curves rather than by looking purely at the number values presented from the data. These trends help to identify the underlying physiology which then sheds light on the limitations being experienced during this assessment.
Please note, that upon interpretation, multiple factors may be identified to be most limiting to an athlete’s performance. This is very common. Exercise and its adaptation is a complicated process, which factors are dominant in limiting performance can result from a myriad of variables including training status, sport, injury, training block, etc. Therefore, this test and its interpretation should be used as a guidepost to help best guide an athletes training based on their weaknesses. The three systems that could be limiting are:
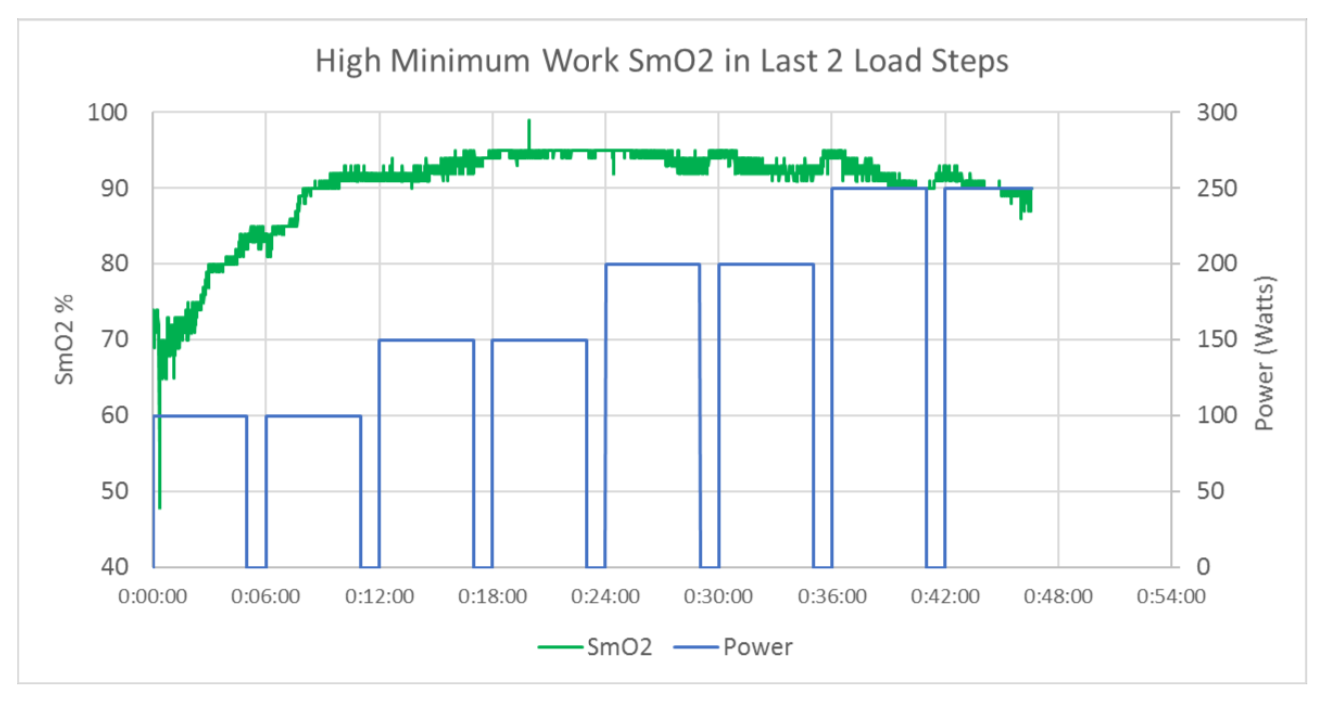
- Muscle Oxidative Capacity – This limitation implies that the athlete can deliver more oxygen than the muscle is able to consume. This could be due to lack of mitochondria resulting in subpar mitochondrial function, low capillary density, an inability to recruit muscle fibers or other causes. This typically occurs in sedentary or less experienced populations. The primary observation is the inability to desaturate at high workloads, shown in figure 1.

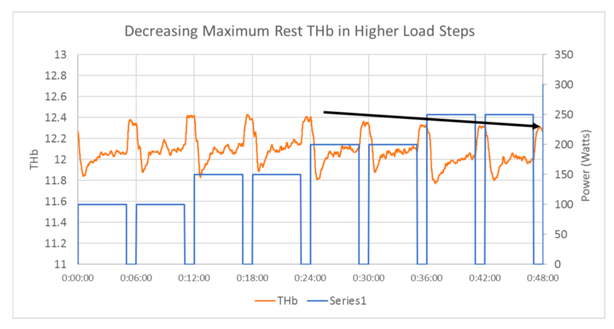
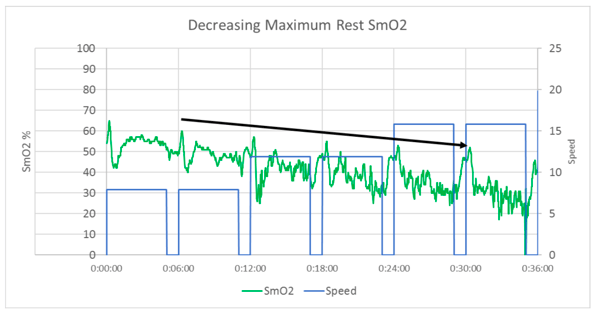
- Cardiac – This limitation implies that the ability of the heart to move adequate amounts of oxygenated blood is insufficient to meet the oxygen demands of the working muscles and organs to support exercise. This typically occurs in more experienced athletes with a slightly more muscular build. And is primarily observed by restricted blood flow to some parts of the body in order to preserve it for others. As in figures 2 and 3 SmO2 is continually decreasing during rest and exercise, and recovery THb is decreasing during the 1 minute rest periods. This indicates that heart is unable to supply ample oxygenated blood to the working muscle during exercise or recovery.
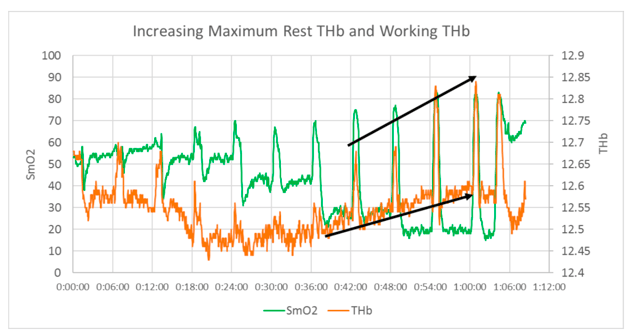
- Pulmonary – This limitation implies that the lungs lack the ability to either 1) load oxygen onto hemoglobin, or 2) adequately exchange CO2 from the body to the environment. A pulmonary limitation is seen from both SmO2 and THb and revolves around CO2 building up and an inability to reload the hemoglobin. Similar to a cardiac limitation SmO2 both exercising and resting will continually decrease as intensity increases. The difference between a pulmonary and cardiac limitation is the response of THb in the later portion of the 5-1-5 Assessment. THb will decrease upon added load, but during the interval will continually increase, while SmO2 continues to decrease. This is a result of the bodies inability to get rid of CO2, CO2 is a potent vasodilator meaning that more blood can flow to the muscle (shown by an increase in THb) furthermore, CO2 makes it harder for oxygen to be bound to hemoglobin thus decreasing SmO2 despite an increase in blood flow.
This blog post provides a concise, albeit simplified, version of the identification of which limiter/s is dominating an athlete’s physiology. Through looking at trends in THb and SmO2, a picture of how an athlete is limited can be constructed. This can then be used to help dictate training. In the next post I will outline some training techniques that can be used to help an athlete overcome various discrepancies in their physiology.