Relationship Between Hbdiff, TSI, and SmO2

We’ve had a few issues come up comparing readings from Portamon and Moxy Monitor. I’ve looked into these issues a bit from a technical perspective. I’d like to share what I’ve found so far.
First, the Portamon and Moxy work quite differently. Moxy uses 4 wavelengths of light (colors) and 2 send-to-receive spacings, whereas the Portamon uses 2 wavelengths of light and 3 send-to-receive spacings. From just this, we can’t say one is better, but we can say they are different.
Next, the Portamon and Moxy algorithms are designed to target slightly different volumes of tissue. As far as I can tell, the Portamon reads from all of the tissue that is under the probe. The Moxy, however, is designed to read the signal from only the muscle. The difference lies in how the skin and fat are included in the reading.
Moreover, the Portamon outputs at least 13 different measurements. See the table below:
|
|
Oxy |
Deoxy |
Total |
Difference |
|
|
Spacing 1 |
T1[Oxy] |
T1[Deoxy] |
T1 Hb Total |
T1 Hb Diff |
TSI |
|
Spacing 2 |
T2[Oxy] |
T2[Deoxy] |
T2 Hb Total |
T2 Hb Diff |
|
|
Spacing 3 |
T3[Oxy] |
T3[Deoxy] |
T3 Hb Total |
T3 Hb Diff |
By comparison, Moxy only measures the muscle oxygen saturation (SmO₂) and relative changes in total muscle hemoglobin concentration. From these, we are able to reverse calculate the relative changes in oxy and deoxy hemoglobin in the muscle for a total of 4 measurements.
This difference represents the key design tradeoff between Moxy and Portamon (you can have your cake or eat it, not both). The Portamon returns 13 measurements, but the exact volume of tissue that is sampled is a bit uncertain. We can’t tell how much of the spacing 1, 2, or 3 signal comes from muscle and how much from skin and fat. Moxy returns less information, but the system is designed to deconvolute or “filter out” the muscle signal from the skin and fat signals. In mathematics, deconvolution is an algorithm-based process used to reverse the effects of convolution, or cross-correlation, in recorded data. We’re able to apply it here to isolate the muscle signal and provide accurate SmO₂ measurement.
The tradeoff between Portamon and Moxy, therefore, is one of more information versus more specific, or “deconvoluted,” information.
Comparing the Readings
So, with all of these differences, is there any way we can compare the data readings between Portamon and Moxy? Comparing TSI to SmO₂ is the obvious place to start, but so far this has proven elusive. In fact, we have seen a couple of cases where the two metrics move in different directions under the same conditions. At this point, we don’t have a clear definition of TSI, nor have we been able to infer a precise definition from the data, so all we can say is that they sometimes correlate, but sometimes not.
We’ve had a bit more success uncovering relationships between Moxy SmO₂ and some of the single spacing measurements from Portamon. In particular, we’ve seen that SmO₂ and Hb Diff are often well correlated.
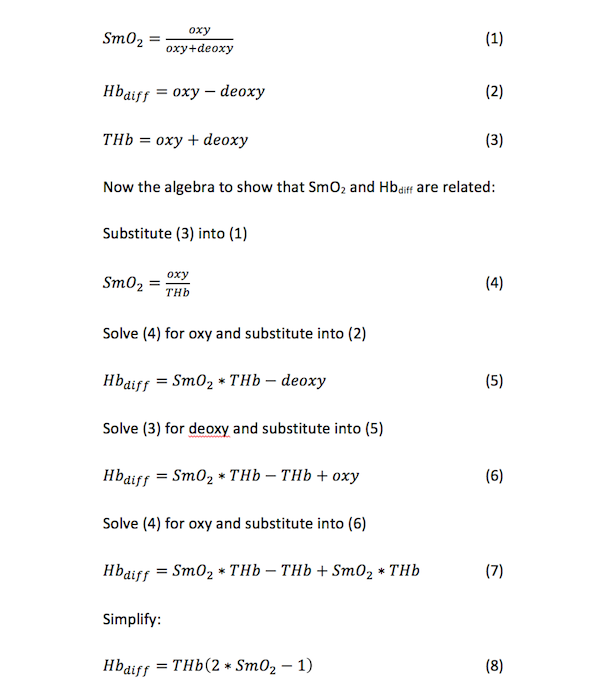
To see why they correlate, we need to do a bit of algebra.
Start with the 3 basic definitions.

The math is a bit tedious, but it does show that if THb is constant, Hbdiff and SmO2 will be perfectly linearly correlated with a slope of 2*THb and an intercept of –THb.
This algebraic relationship explains why we often see the Moxy SmO₂ and the Portamon HbDiff to be correlated during a single test. Often, the THb changes very little and the skin and fat contributions are relatively constant. Under these conditions, the relationship holds up.
Unfortunately, we don’t know the mathematical definition of the TSI reading, nor been able to infer one from the data we’ve seen so far. In the absence of this, we’ll have to leave the understanding of the exact relationship between TSI and SmO₂ for a later date.
Follow @MoxyMonitor

