
Power, considered one of the most reliable indicators of cycling performance, is an excellent medium to measure training effort or intensity. Power measurement is highly important for cyclists, triathletes, and other endurance athletes because it offers immediate feedback on training zones, thresholds, and sustainable power output levels. Two popular terms for measuring power are Critical Power, CP, and Functional Threshold Power, FTP. Although similar, these two terms have some notable differences.
What Is Critical Power?
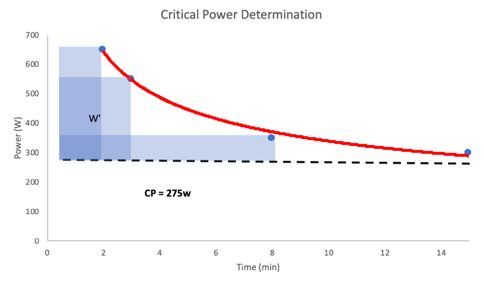
Critical power is the asymptote of the power duration curve (figure 1) created from 3 to 4 individual tests where power is the maximum sustainable power output for a given time, ranging from 2-15 minutes (Poole 2016). From this curve W’ or non-aerobic work at intensities over CP can also be determined. Critical power is time trial (TT) pace, or the intensity that is on the limit of sustainability and W’ is your capacity for all-out and high intensity effort.
What Is Functional Threshold Power?
Functional threshold power (FTP) has been defined at least 3 different ways in scientific literature (Poole 2016). It was first described as the maximal power output an athlete can sustain for a period of 60 minutes, it’s also been proposed that FTP is 95% of sustainable power for 20minutes or finally, 90% of sustainable power for 8minutes (Allen and Coggan 2010).
How Does Critical Power Differ from Functional Threshold Power?
CP is determined as the asymptote of multiple average power or specific time to exhaustion tests, from these data points a curve is constructed and delineates the high from severe intensity zones. FTP is determined as a percentage of the average power of one all-out effort of 8-60minutes. Given that testing conditions are controlled for properly CP and FTP should be very similar. From the CP curve a non-aerobic work reserve W’ can also be determined which describes the amount of work that can be done above CP. W’ is valuable because it allows a race strategy to become more detailed, allowing an athlete to cover surges where power is over CP while giving them an idea of how long they can maintain that intensity.
How Is Functional Threshold Power Measured?
Using a bicycle power meter, FTP can be determined in three different ways. 1) The maximal power output an athlete can sustain for a period of 60 minutes. 2) 95% of sustainable power for 20 minutes or finally, 90% of sustainable power for 8 minutes (Carmichael and Rutberg 2009).
After an adequate warm-up, complete 1 of the three tests above, bouts of 20 minutes and 8 minutes are much easier to complete from both a time, and concentration stand point. Maintaining maximal effort for 60 minutes is very challenging for most athletes, so focusing on high quality work for shorter periods of time seems more digestible. Remember, if a time trial of 8 or 20 minutes is completed FTP is determined as 90 or 95% of that maintained effort.
FTP and Training Zones
After determination of FTP or CP athletes can then use this base value to determine training zones. For example, zone-one training is any exercise conducted at less than 55% of an athlete’ FTP; zone two is between 55% and 74%; zone three between 75% and 89%; zone four between 90% and 104%; zone five between 105% and 120%; zone six between 121% and 125%; and finally, zone seven at more than 125%.
While different evaluation tools are used to calculate CP and FTP, the goal of both tests is to determine the power output that can be maintained for extended periods of time. From this determination it is then possible to break training into different power zones to elicit the necessary changes for better performance.
Follow @MoxyMonitor
